


The Atlas of Ecosystem Services Bavaria is part of the research project “Modeling and Assessment of Ecosystem Services under Climate Change” in the joint project LandKlif. It is developed and supervised by the Chair of Ecological Services at the University of Bayreuth.
What are ecosystem services?
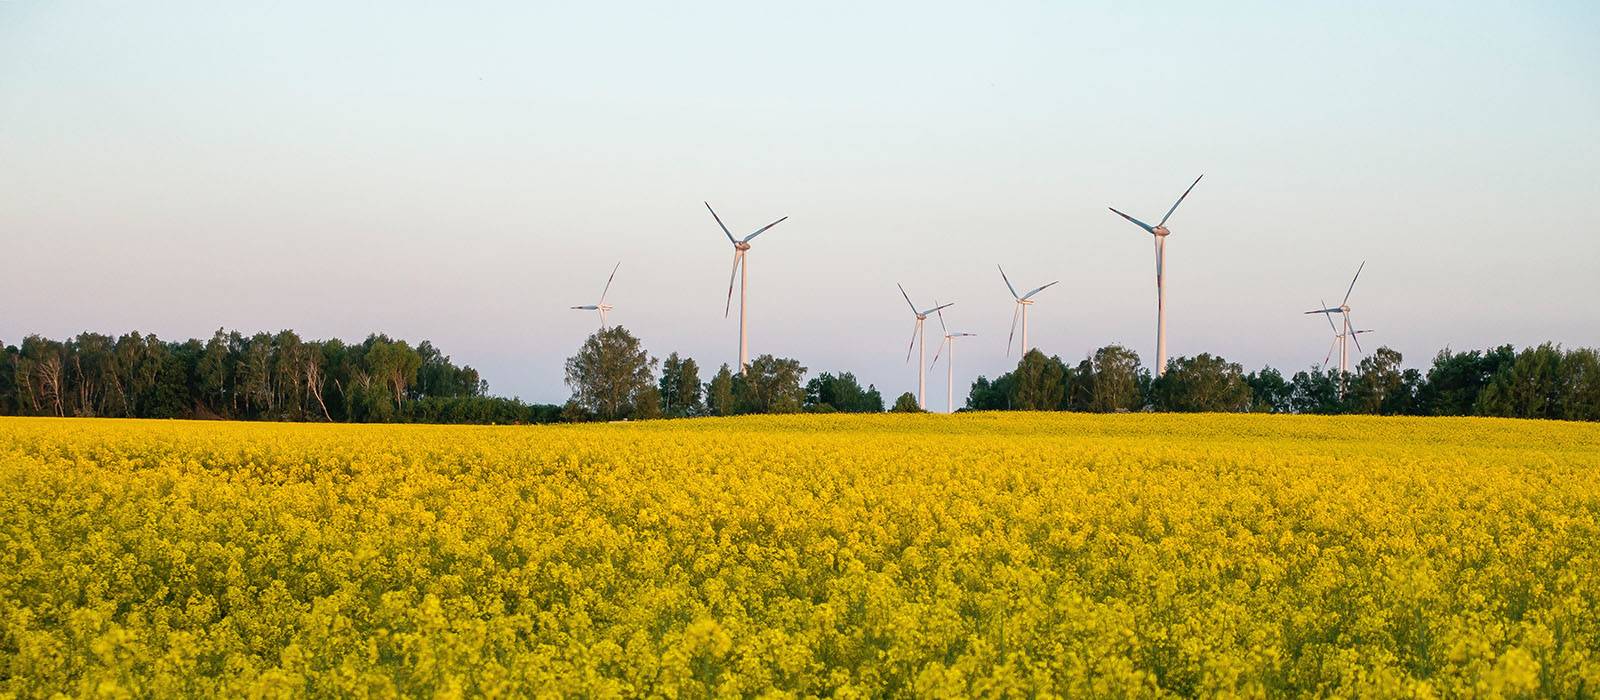
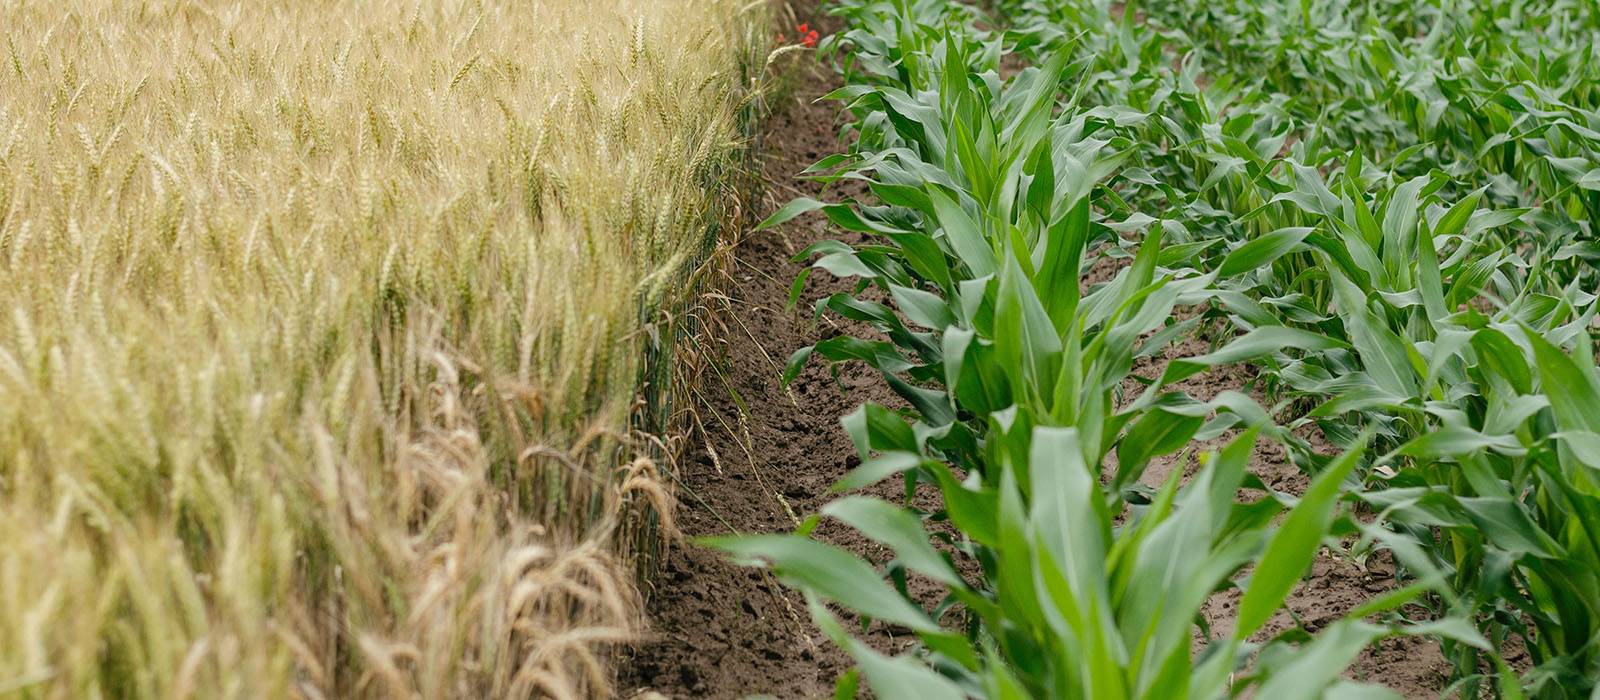
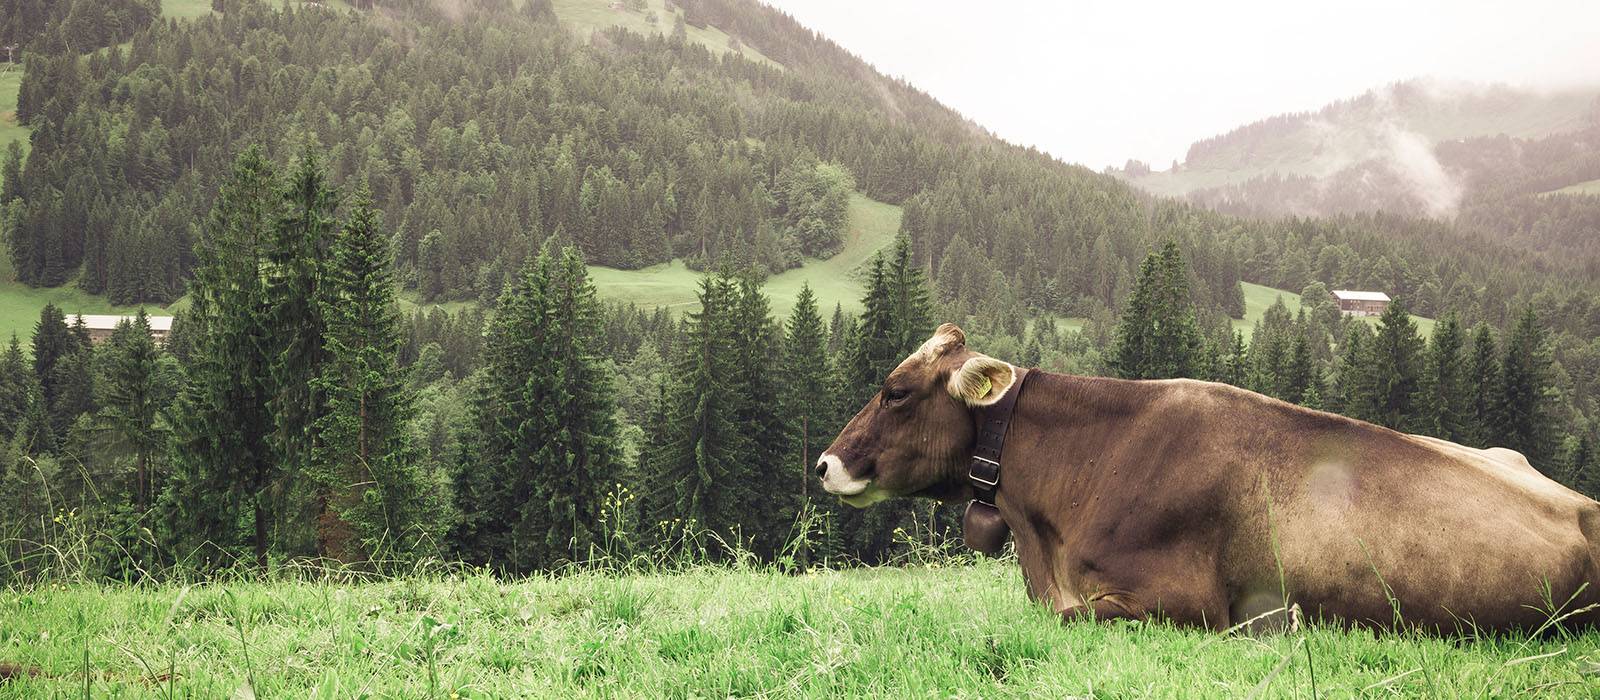
Ecosystem services refer to the benefits we humans receive from nature and the landscape. These include, for example, food production, regulation of the global climate or recreational opportunities. These services, which nature and landscape provide us with on a daily basis, are often unknowingly used by society and the economy. Climate change and changes in land use can severely impact the natural capacity of nature.
About the Atlas
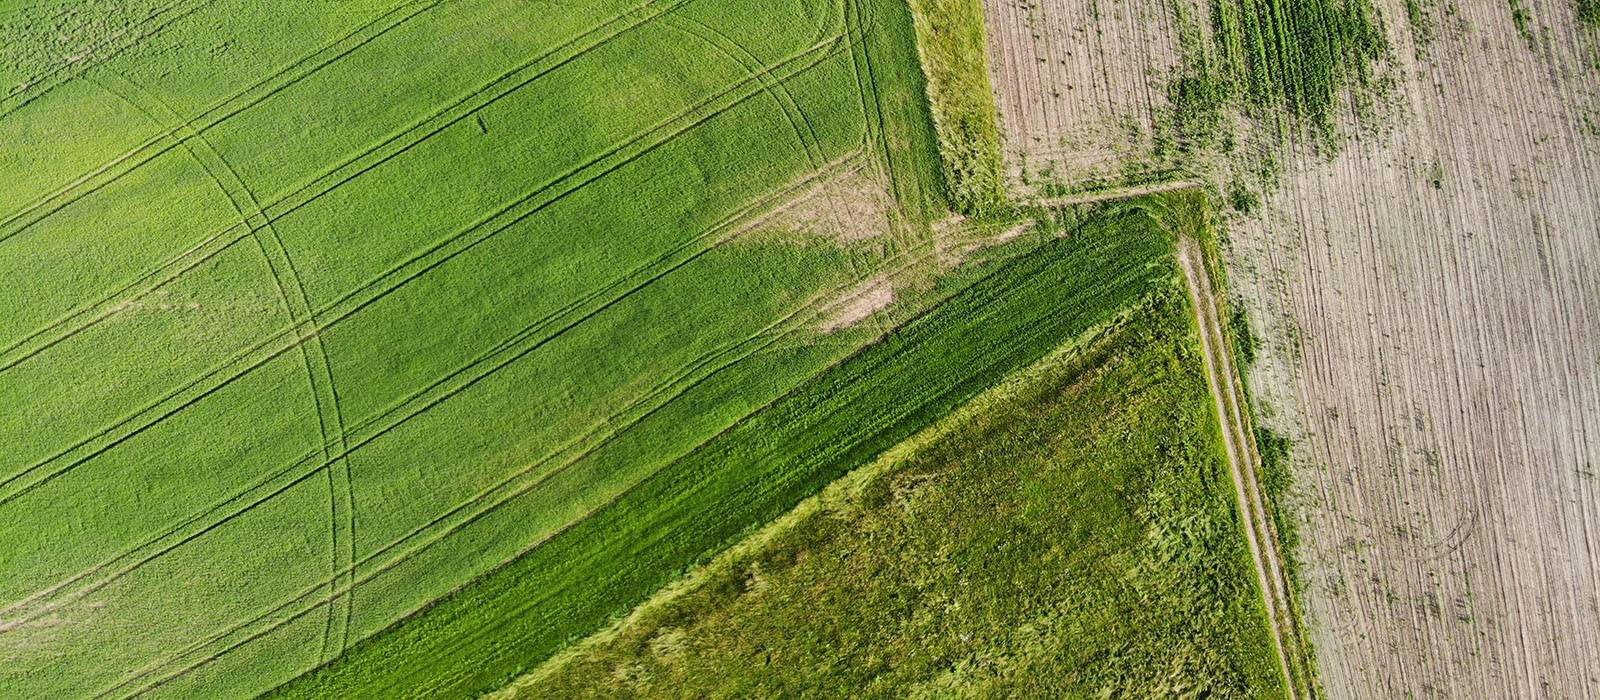
In this atlas, ecosystem services, the influencing factors climate and land use as well as biodiversity in the different regions of Bavaria can be explored. Depending on the performance are shown:
Bavaria-wide data based on indicators, models or field measurements as well as the
social significance of the services based on surveys.

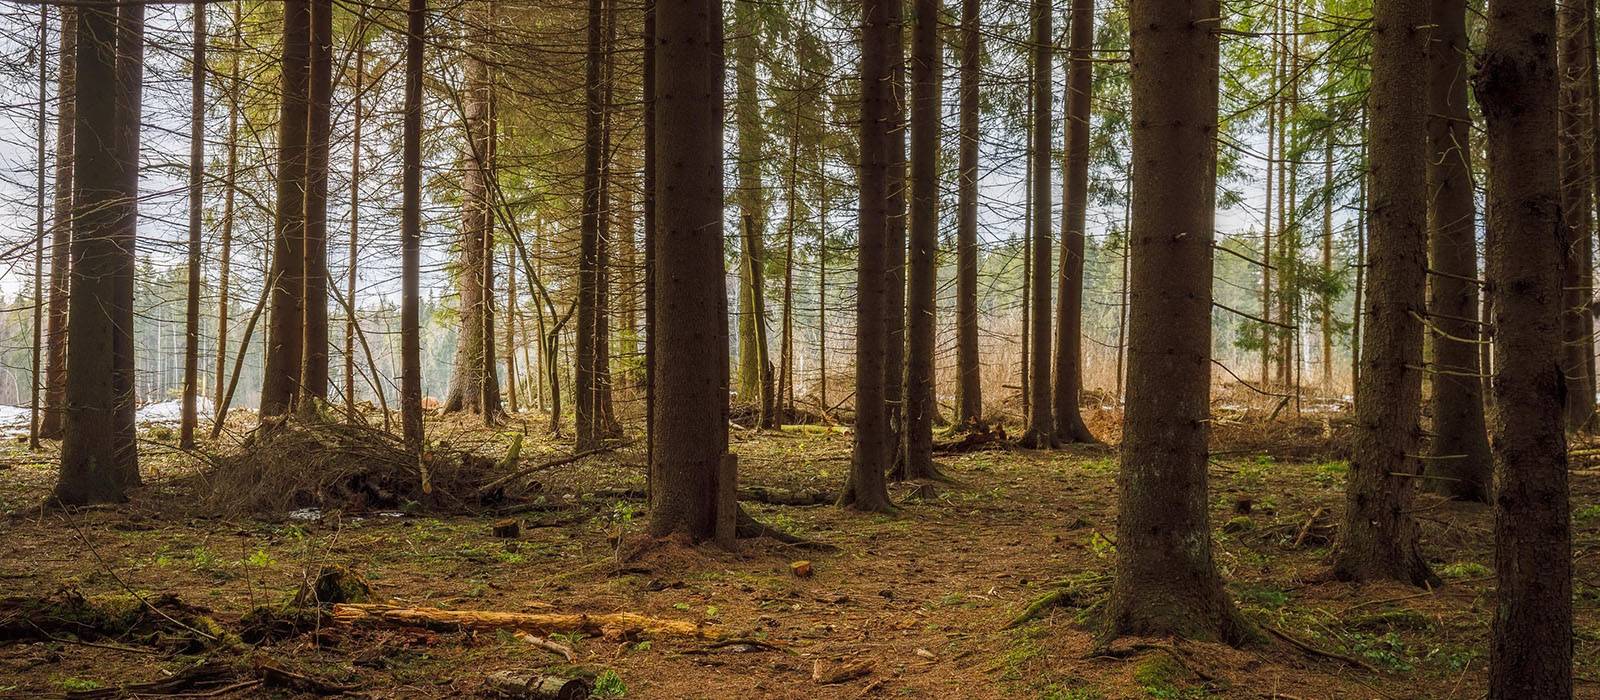
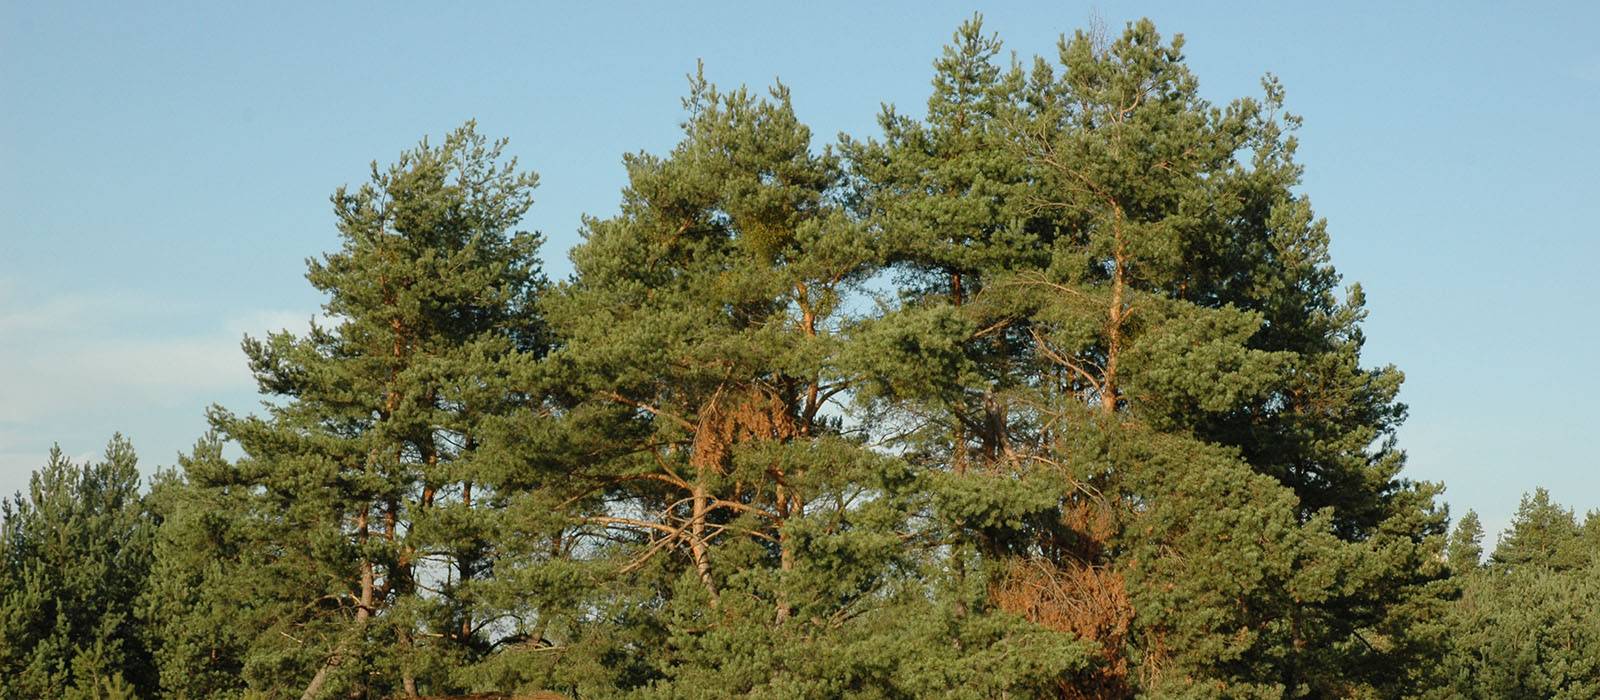
Brand new in the research project BAYSICS: With the analysis tool “TreelinePredict”, the thermal limits of tree species in the Bavarian Alps can be simulated.
Users can click on any tree occurrences from the BAYSICS portal on an interactive map and simulate those areas, whose thermal mesoclimate today and with further warming (+1 degree Celsius and +2 degree Celsius) suggests further tree occurrences.
Try it out: Link to TreelinePredict

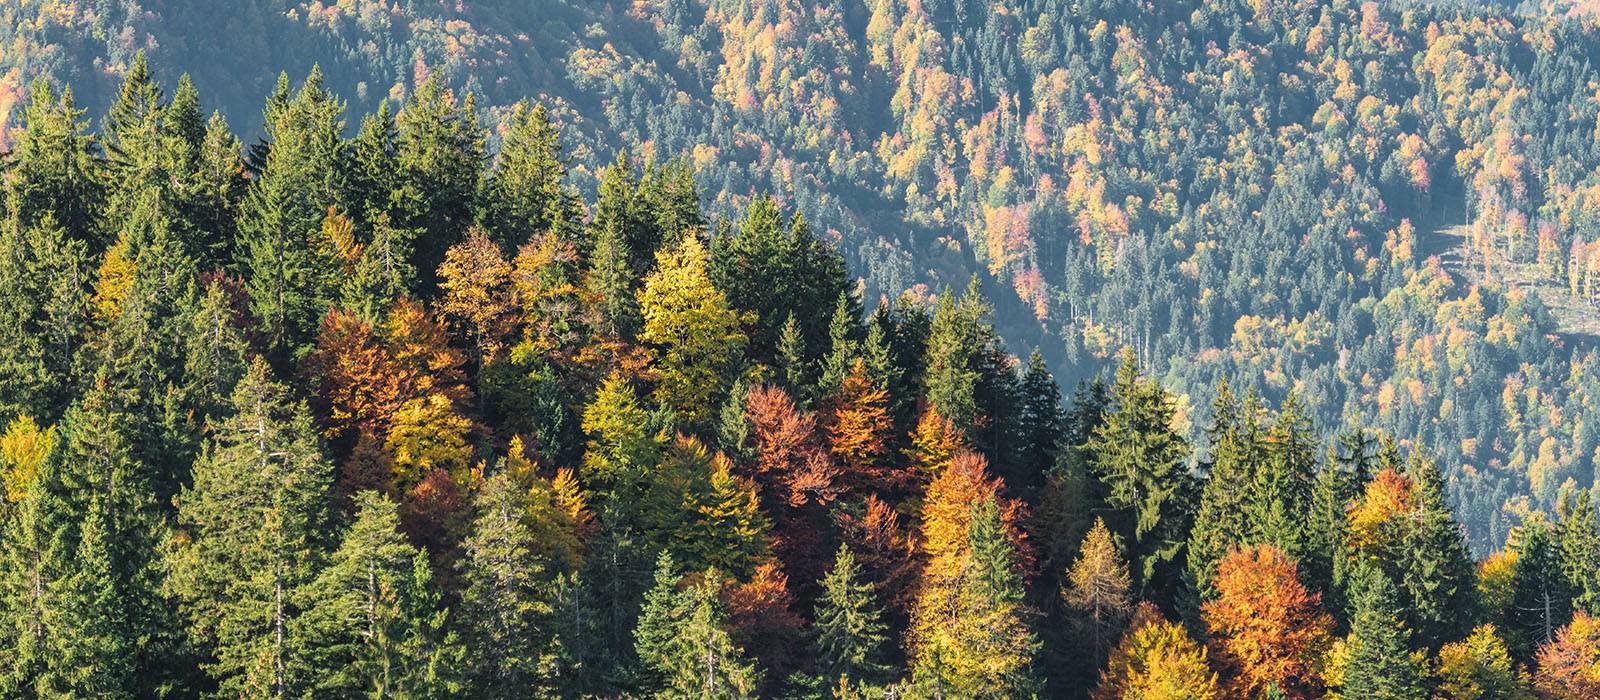
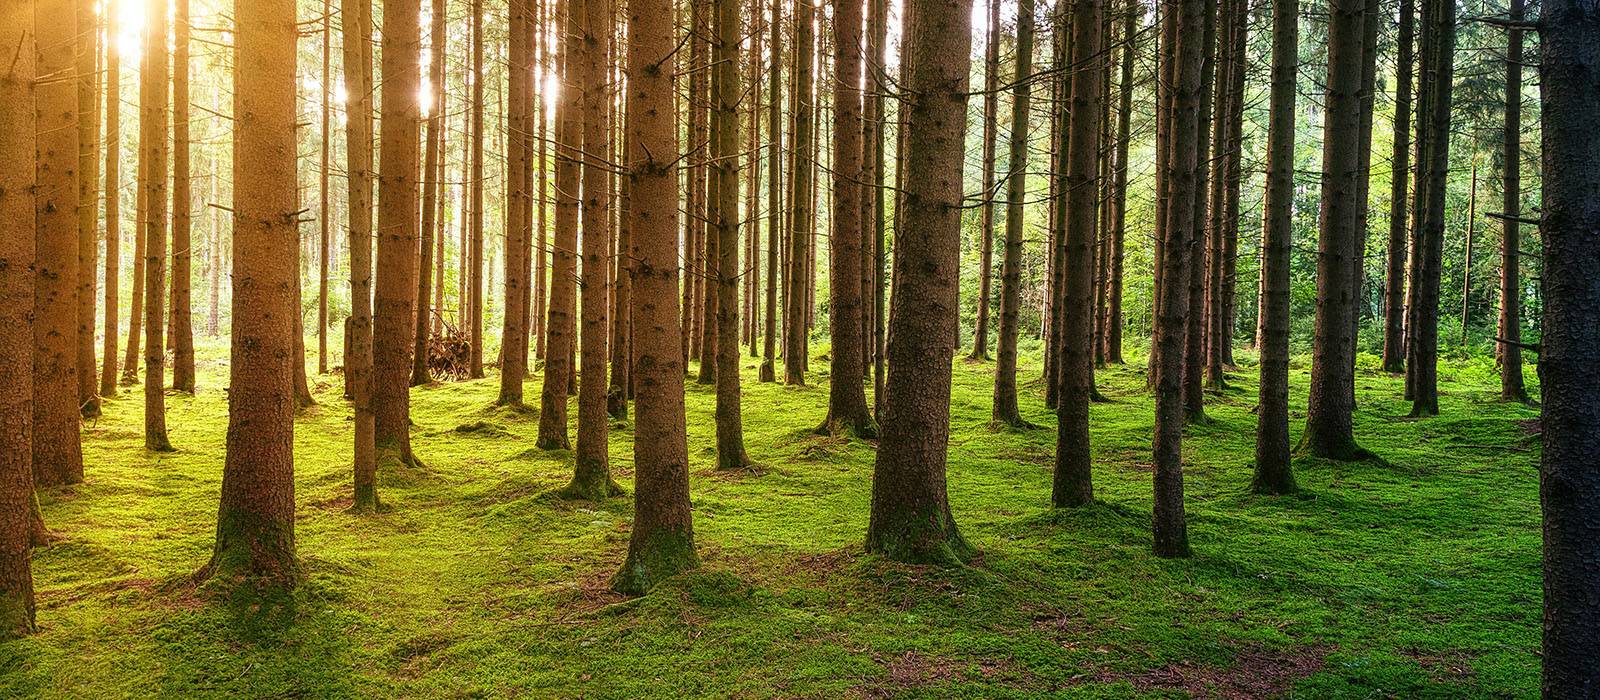
How is our forest currently doing? The forest condition monitor, developed by BLIZ and HyBBEX, can be used to extensively visualize the condition of forests in Germany and Europe.
To this end, remote sensing data is used to determine the greenness of the vegetation and to compare it with long-term observations with the help of quantiles and proportional deviations.
If you prefer to learn in an audiovisual manner, you can access an (English) introductory video.

Citizen scientists can now investigate the impact of climate change on the time of bud burst with a twig experiment.
TECCS (Twig Experiment Climate Change Simulator) is an easy-to-use simulation tool to analyze the potential impact of winter and/or spring warming on the time of bud burst.
Learn to use words like “forcing” and “chilling” while actively participating in science? It’s easy with TECCS! Go for it!

Join in: use your own smartphone or desktop computer to report your observations on plants, allergenic species, tree lines or animals and contribute to climate change.
The aim is to document and analyze climate-based changes in nature through as many observations as possible.
The following areas are of interest:

Within the BAYSICS projects, four fully interconnected sensor trees (Tree 4.0 or “Talking Tree”) were installed in Augsburg, Berchtesgaden, Eichstätt and Munich, in order to cover different climate areas in Bavaria. Each tree gives interested citizens and scientists insight into the water balance and growth behavior in different weather conditions and situations of increased stress.
The website tracks each tree and how the local temperature of soil, air and leaves, soil humidity and other parameters change throughout the year. In addition, web cams give live impressions on the everyday tree life.
This analysis tool visualizes the effect of climate change on the seasonal development of plants.
One can choose between five climate stations with different recording periods and display the phenological seasons. For example, the analysis tool uses data for the cherry blossom in Kyoto/Japan data since the year 801, for the hazel blossom (early spring) in Geisenheim /Hesse since 1900.
The number of days for deviations from the mean date of occurrence (1971-2000) is shown as a colored stripe: Green tones for earlier date, blue tones for later date.
Just try it out: Link to the analysis tool “Grüne Klimastreifen / Green warming stripes”.

PhenoInterPol visualizes phenological interpolation maps in Bavaria. The phenophases of selected plants are stored for the period 1951-2020, e.g. the flowering of the hazel and the forsythia, the leaf unfolding and the leaf fall of the English oak.
Users:inside PhenoInterPol can perform basic analyses themselves, enter their own phenological observations and put them in context with historical data.
Just try it out: Link to the analysis tool “PhenoInterPol”.